

COVINGTON, Ga. - Dear Mayor Johnston:
Thank you for your letter from earlier today. We believe there is a fundamental misunderstanding on how to interpret air monitoring results, so we wanted to share the perspectives of three toxicology experts that have reviewed both the City of Covington’s and BD’s air monitoring results.
BD and our third-party toxicology experts believe the residents of Covington need to understand the views of multiple scientists who have spent their careers performing long-term risk assessments on human health.
We would reiterate our offer to discuss this in more detail with our experts and any toxicology experts the city has advising you. We believe that the residents of Covington deserve to understand the scientific facts and be assured that the BD facility is not creating health risks to the community.
First, we will start by saying this is a very limited sample, and sampling results are snapshots in time. No one result can be taken as representative of long-term exposures, nor can short-term sampling provide enough data to determine lifetime risks.
Second, when air monitoring values fluctuate up and down at a single spot, that should be noted, and all measurements should be considered when assessing exposures over time, not just the highest value, since long- term health risk generally depends on consistent long-term exposure.
In most environmental studies, averaging data points of a single location over time using the geometric mean, is a preferred method of analyzing air monitoring data. This is because health risks are based on consistent exposure over 24 hours a day, 365 days a year for a lifetime, which is considered 70 years. You cannot draw conclusions from any one level on any one day.
When you analyze measurements from any monitoring location, you have to take an average to show what the exposure is over whatever time period is being measured. We would encourage you to get an opinion from a board-certified toxicologist to verify this approach.
Using the geometric mean of your measurements (excluding duplicates), the City of Covington’s air monitoring results look like this:

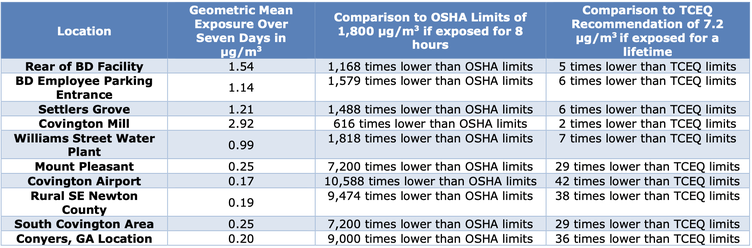
As you can see in the chart above, the geometric mean measurements across all locations in Covington are below levels proposed by the Texas Commission on Environmental Quality (TCEQ) for public safety.
For work places, measurements are well below the OSHA permissible exposure levels (1 part per million over 8 hours or 1,800 μg/m3). TCEQ’s levels for community exposure limits took into account background EtO from other sources, including the human body.
There is no question from toxicology experts who understand how to interpret these data that BD is operating our facility safely and there are no risks to short- or long-term health of our employees or the community.
To understand the amount of EtO emitted from everyday sources, the Advanced Medical Technology Association (AdvaMed) commissioned a study using Montrose Air Quality Services, the same firm you selected for air monitoring in Covington, and found EtO emission levels that far surpass any levels measured anywhere around Covington.
A selection from that report is included below, with a comparison to the highest geometric mean level of EtO found in the Covington Mill neighborhood. The full report can be found at https://www.advamed.org/sites/default/files/resource/everyday-sources-ethylene-oxide-test-report.pdf.
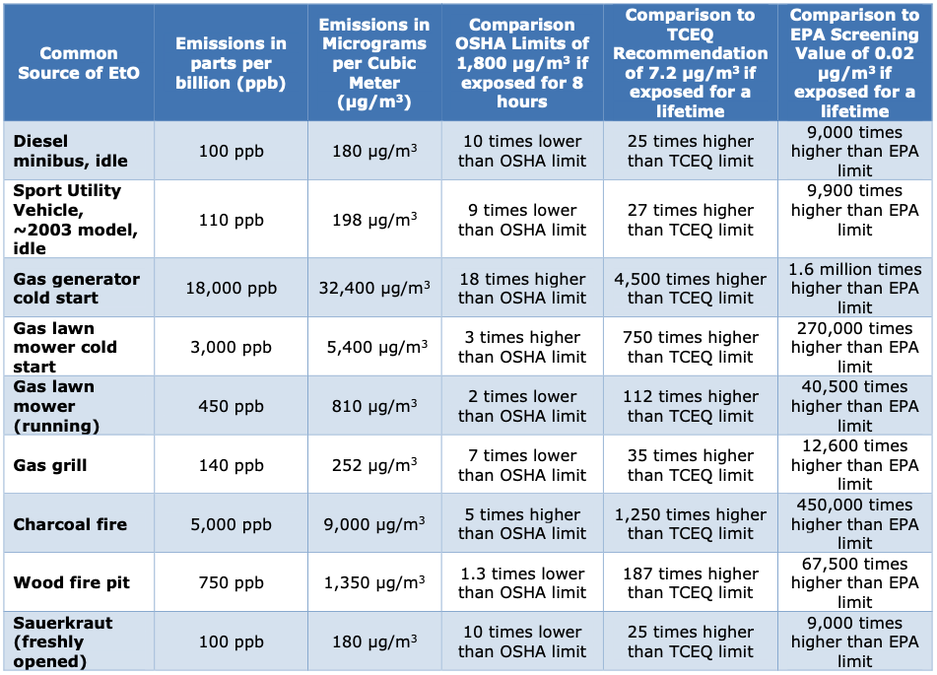
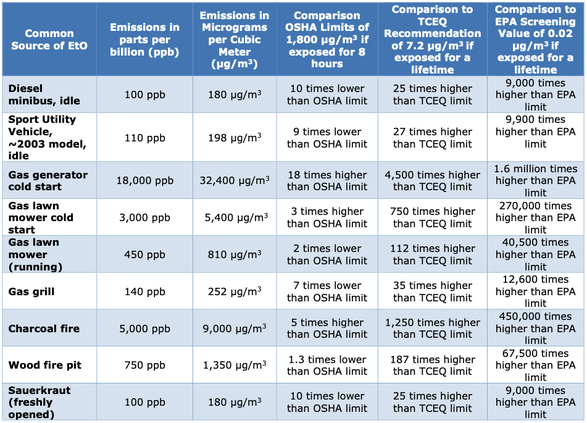
The data above is not intended to say that these everyday items are unsafe, it is simply to show context, and to illustrate how a single value cannot be used to represent long-term exposure. Daily, localized levels of ethylene oxide will correspond to a variety of sources, some present on some days, some on others.
Given the results you presented and interpretation of that data from leading toxicologists, we will continue operations as normal at our Covington facility. There are absolutely no short- or long-term risks that would necessitate any reduction in operations at the site.
All three toxicologists have co-signed this letter and each have contributed their individual views, which you will find as an attachment to this letter.
Respectfully,
Ellen Kondracki
Vice President, Environmental, Health and Safety BD
Dr. Jonathan Borak, M.D.
Clinical Professor, Medicine Yale University
Gail Charnley, Ph.D.
Principal, HealthRisk Strategies
Michael Dourson, Ph.D.
Scientific Director, Toxicology Excellence in Risk Assessment
Initial thoughts regarding the Covington air monitoring results
Gail Charnley, Ph.D.
The geometric means of the ethylene oxide monitoring data from the Settlers Grove and Covington Mill areas, while somewhat elevated compared to the other monitored areas, are still well below any occupational exposure limits or the TCEQ level of concern. The TCEQ level of concern is a lifetime exposure limit, not a short-term exposure limit. People will not be experiencing an entire lifetime’s exposure at these levels.
Furthermore, the comparatively elevated air monitoring samples near the plant were taken during the temporary ethylene oxide leak that BD reported and rectified when it was detected. It is likely that repeat sampling in the absence of the leak would produce concentrations closer to those more distant from the plant.
These results do not suggest that there should be a concern about the safety of the neighborhoods near the BD plant.
Initial Analysis of City of Covington Air Monitoring Results
Michael Dourson, Ph.D.
The Montrose report gives EtO values at a number of sites in and around the City of Covington. Monitoring results show the expected fluctuations over time, some of which might be the result of an inadvertent EtO leak from the BD facility during the monitoring period.
However, and importantly, the average concentrations from all of these monitors are well within safety limits proposed by TCEQ, and in many cases similar to what humans make in their bodies on a daily basis.
The most reasonable monitor for determining the expected Covington background air EtO level appears to be that of the Williams Street Water Plant. Values here are somewhat higher than in outlying areas, such as the Covington Airport, but this is to be expected due to additional EtO emitting sources in the city.
Comparison of levels at the Williams Street Water Plant with either of the two BD monitors shows similarity in 4 out of 7 days, indicating that the air around the BD facility is at the Covington background level during this time.
For 3 days, concentrations at the BD monitors are considerably higher, likely due to the inadvertent leak mentioned above. However, this leak did not result in concentrations that would cause a health concern.
The City of Covington may also wish to check out a potential source of EtO emissions at the Covington Mill Area location. High readings occurred on three days at this location that were not consistent with lower readings from the BD facility.
Thus, BD does not appear to be the source of these high readings.
First impressions of the Covington monitoring
Jonathan Borak, MD
1. There is substantial variability of sampling results, both across days and between the Montrose and ERG results of duplicate samples. The former is less surprising, the latter is more so.
The 8 paired Montrose and ERG samples differed by about 35-100% or more. Moreover, there is no consistent pattern: some ERG samples were greater than their paired Montrose samples, while others were smaller.
Because I understand that there were side-by-side duplicate samples, such differences imply that the actual reported results are subject to substantial analytical uncertainty and should be regarded as reflecting a likely range, rather than a precise measurement.
2. For each of the ten locations, I calculated both arithmetic and geometric means across the seven days. For convenience, I did not include the duplicate-or-ERG analyses. The results are shown in the following table:
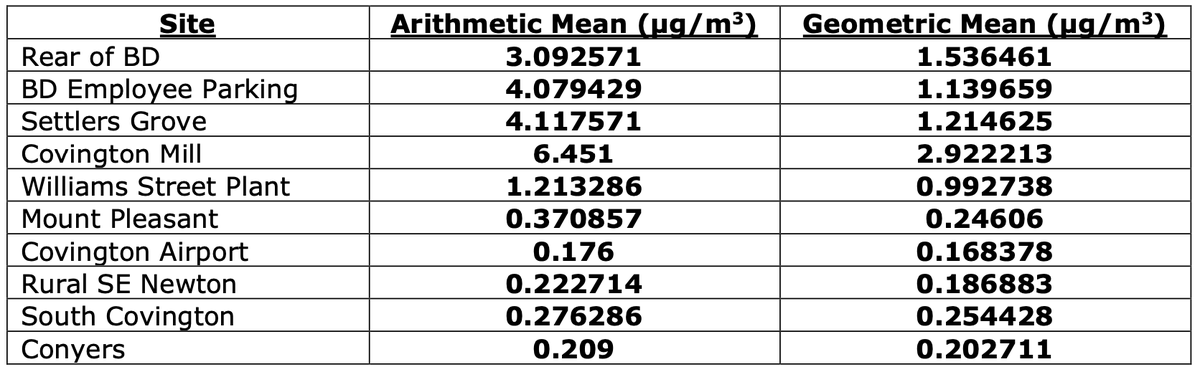

These data can be compared to the EPD South DeKalb Monitoring Site (0.144 μg/m3), which appears to be the most distant site from the BD facility and therefore something of a remote control.
Because the arithmetic mean is strongly influenced by occasional outliers, I prefer to rely on the geometric mean for summarizing such data. These results are similar to the median, but they include all of the available data points.
3. The data summary table above indicates that on average, exposures are not substantially elevated: they are well below the safety limits proposed by TCEQ. Moreover, they indicate that to the extent that any of these measurements reflects the impacts of the BD site, the effects are very localized.


